Weekly Analysis Report
The report presents the analysis for Marriott Campaigns in US and provides the bird's-eye view and performance related insights with respect to different States, Divisions etc. For more details and forecasted results, please refer Performance Dashboard!
Overall Campaign Stats
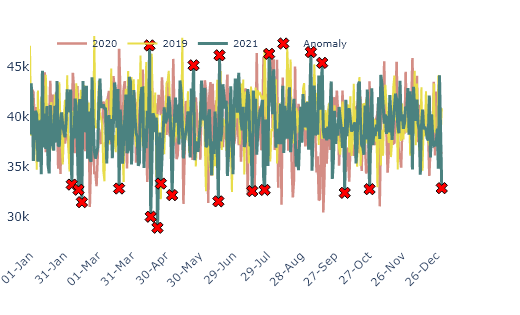
The figure on right shows the Campaign trend on daily basis. Please refer some stats based on graph,
- The average number of booking per day is 39,783 which is 0.4% higher than 2020 and 1.3% higher than year 2019.
- The average number of bookings on Weekdays are 1.00 times higher than weekends for the date range Jan-2019 till date.
- There are 17 anomalies found which is marked in red in the graph.
Campaigns Compared to Last Week
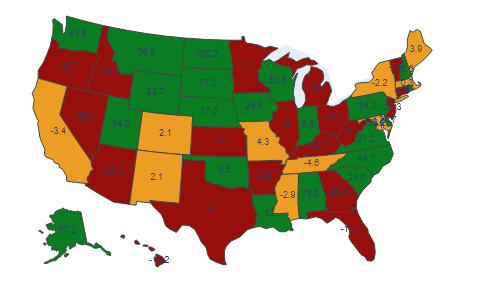
The figure on right shows the Campaigns for each state with respect to previous week. The number on each state shows the percentage increase or decrease in Campaigns compared to last week. Please refer more observation below,
- The overall bookings this week increased from the previous week by 16.93%
- Utah, Iowa, West Virginia, New York and Arkansas record lowest percentage bookings as compared to last week.
- New Mexico, Nevada, Mississippi, Indiana and Washington record highest percentage bookings as compared to last week.
Campaigns Compared to 2019
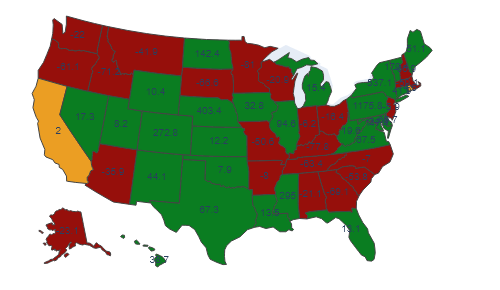
The figure on left shows the Campaigns for each state with respect to 2019. The number on each state shows the increase or decrease in Campaigns compared to 2019. Please refer more observation below,
- The overall bookings this week increased compared to 2019 by 100.95%
- The States District of Columbia, Michigan, Illinois, New Hampshire and Maryland record lowest percentage bookings as compared to year 2019.
- The States Oklahoma, Florida, Louisiana, Missouri and Alaska record maximum percentage increase in booking as compared to 2019.
Campaigns for Each States YTD
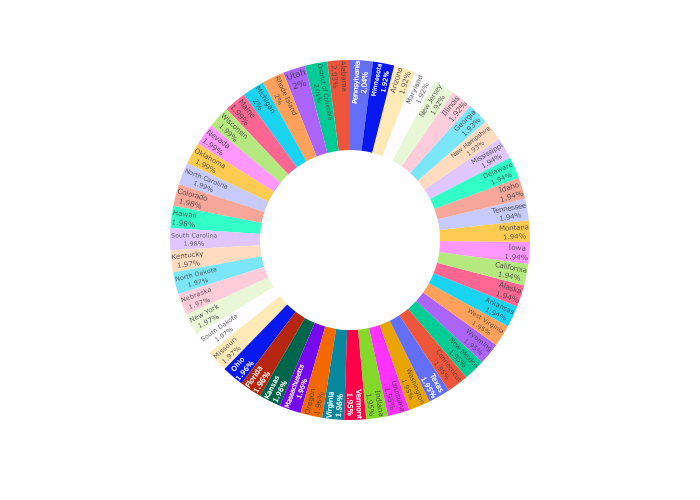
The pie chart on right shows the Campaigns percentage for each state for 2021 YTD. Please refer more observation below,
- The top 5 states with highest booking YTD are Hawaii, Rhode Island, Louisiana, Florida and Arizona.
- The top 5 states with lowest booking YTD are Indiana, New York, Nebraska, Pennsylvania and Oklahoma.
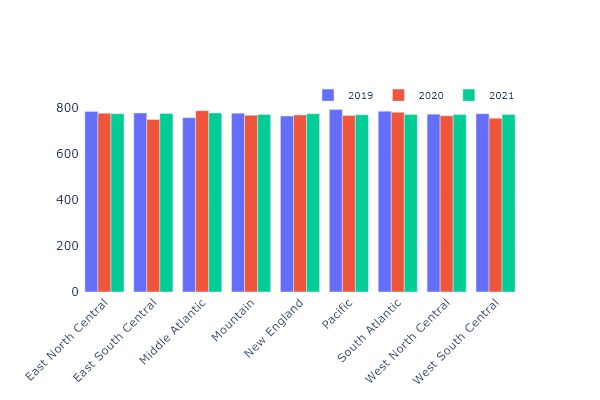
Campaigns : Division Based Analysis
The figure shows per day Campaign for each year for all divisions in USA. Here are few observations from this..
- The average number of bookings per division per day in 2021 is 775, which is 0.5% more from 2019 and 0.1% more from year 2020
- The division New England has recorded average highest number of per day booking of 779.
- The division Middle Atlantic has recorded lowest number of per day booking of 763.
Thank you for your time. Please revert in case of any suggestions or query.